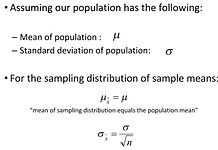
Unit 4: Sampling Distributon
Definitions:
-The value of a parameter is unknown
-value of a statistic is calculated from a sample of the population and is often used to estimate an unknown parameter
-bias of a statistic is different than bias in a sampling method.
-concerns the center of the distribution
-a statistic used to estimate a parameter is unbiased if the mean of its sampling distribution is equal to the true value of the parameter being estimated
-variability is determined by the spread of the distribution
-spread of the distribution is determined by two things
-sampling design
-size of the sample
-as long as the population is much larger than the sample (at least 10x), the spread of the sampling distribution is approx. the same for any population
-Central limit theorem
-assuming the sample size is large enough, the sampling distribution of a sample mean is approximately normal no matter the shape of the population distribution
-the larger the sample size, the sampling distribution becomes more normally distributed
Confidence interval mean:
-we are 95% confident the number of cokes sold is between is between 47 and 55
-this does not mean there is a 95% chance the mean number of cokes is between 47 and 55
-(47,55) is just one 95% confidence interval. of all the possible samples we take, 95% of them will capture the mean. We have no idea if this specific interval does capture the mean or if it does not.
Z-interval: estimating for a mean when the standard deviation of the population is known
-state: we will estimate for the mean of the population in context
-name procedure: z interval
-conditions for using the z interval: standard dev. is known. The data is an SRS from the population. The sampling distribution is justified to be normal.
-carry out the procedure (mean +_ z* std.dev/ Sqrt(n))
-interpret your results in the context of the problem. We are __% confident that the mean of the population is between___ and ___
-z* or critical values
-interval: -z* to +z* contains an area of c
Communicating your solutions: whenever you are asked to construct a confidence interval you MUST state these 4 steps
-identify the population and the parameter we are investigating
-choose an appropriate inference procedure. Verify the conditions for using this procedure
-carry out the procedure
-confidence interval = estimate +- margin of error
-interpret your results in the context of the problem
The T-Distribution: flatter than the standard normal curve
-the flatness depends on something called degrees of freedom (DOF)
-degrees of freedom=sample size - 1
-as DOF goes up ---> t-distribution becomes more like the standard normal curve
-1.the same as before. state the population and parameter
-2.the procedure we will use the T-interval procedure since we are estimating for a mean and do not know the standard deviation of the population
-random condition:data is from a random sample of population and the values in the sample are independent of each other. An SRS meets this requirement.
-Step 2: continued
-normality condition: if the population is stated as normal the sample distribution will also be normal allowing use of the t-distribution.
-if the population is not stated as normal the condition can be met depending on the sample size
-if n>30 then the CLT will apply
-if 15<n<30 the sample data needs to be graphed and should be roughly symmetric or slightly skewed with no outliers
-if n<15 then the sample data needs to be graphed and the sample data must be roughly symmetric with no outliers ot meet the condition
-You need to graph the sample data if you can not meet the normality requirement
-step 3: different equation
-construct the interval
-step 4: the same
-interpret the results in the context of the problem


